Filtering
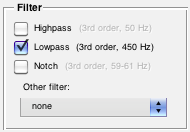
FeatureFinder offers three standard filtering options and then a set of custom filters that can be customized or added to by you! These options can be controlled from the “Filter” pane on the left hand side of the window.

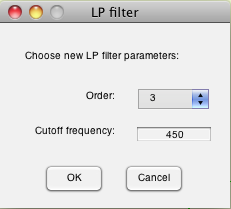
To select a filter, simply click its checkbox so that a check-mark is displayed. All three filters are Butterworth filters, and you can change their order and frequencies by clicking on them (e.g., clicking on “3rd order, 450 Hz” above). You will be presented with a new window that will allow you to choose a new filter order and frequency.

To implement one of the custom filters, simply choose it from the “Other filter” drop-down menu.
Normalization
Normalization rescales the filtered data as z-scores. Specifically, it groups your data by its first parameter—say “Participant”—, then determines the overall mean and standard deviation of the data in each group of files. Then, the data in each file is subtracted by the overall mean of the group, and then divided by the overall standard deviation of the group. That’s all there is to it!

NOTE: Filter and normalization settings are channel-specific, meaning that you can setup a different scheme separately for each channel.
| << View and export your data | Extracting features >> |

